Posture dashboard

The whole estate, at a glance

Start every day with the numbers that matter: how much you have, how it's shared, and where the exposure concentrates - no spreadsheets, no manual counts.

  • Directory totals - sites, drives, users, and groups counted and trended over time.
  • Sharing link scopes - anonymous, organization, and direct links broken down at a glance.
  • Storage by owner and site - see which sites and drives are actually holding your data.
  • Always current - a scheduled sync keeps the dashboard fresh without manual refreshes.
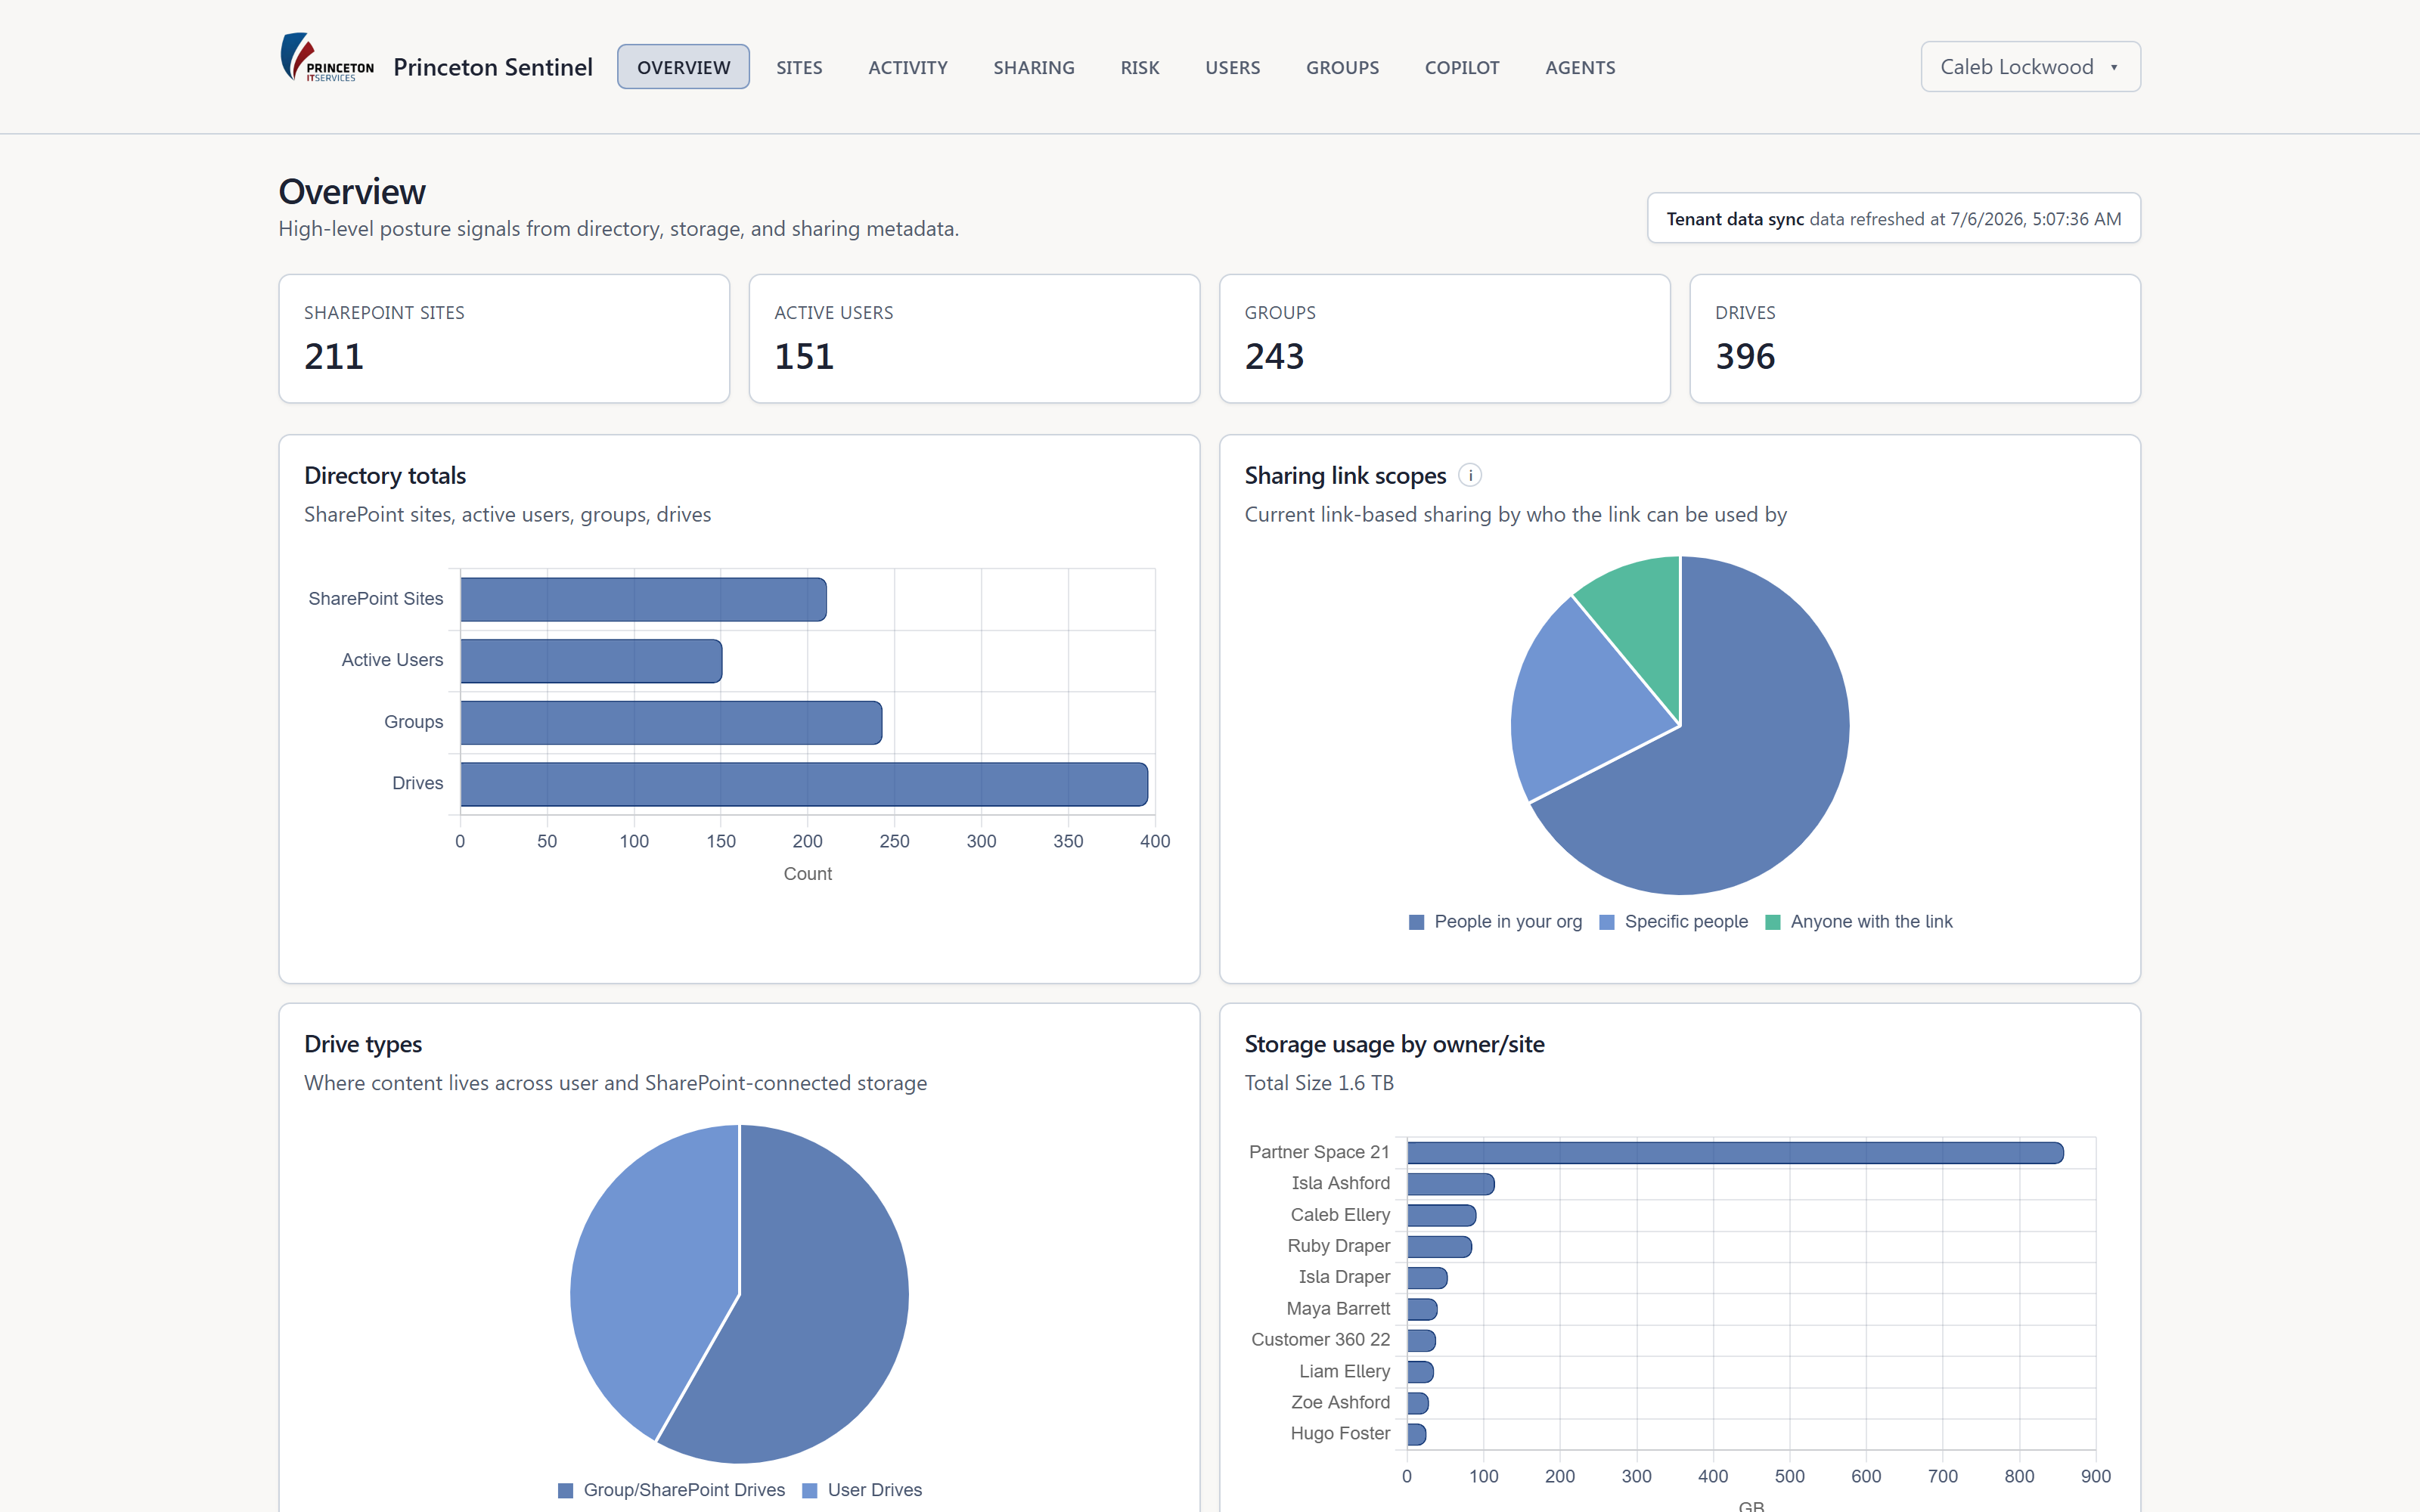
app.princetonsentinel.com/dashboard
Posture overview with KPI tiles, sharing pie, and storage-by-site bar chart
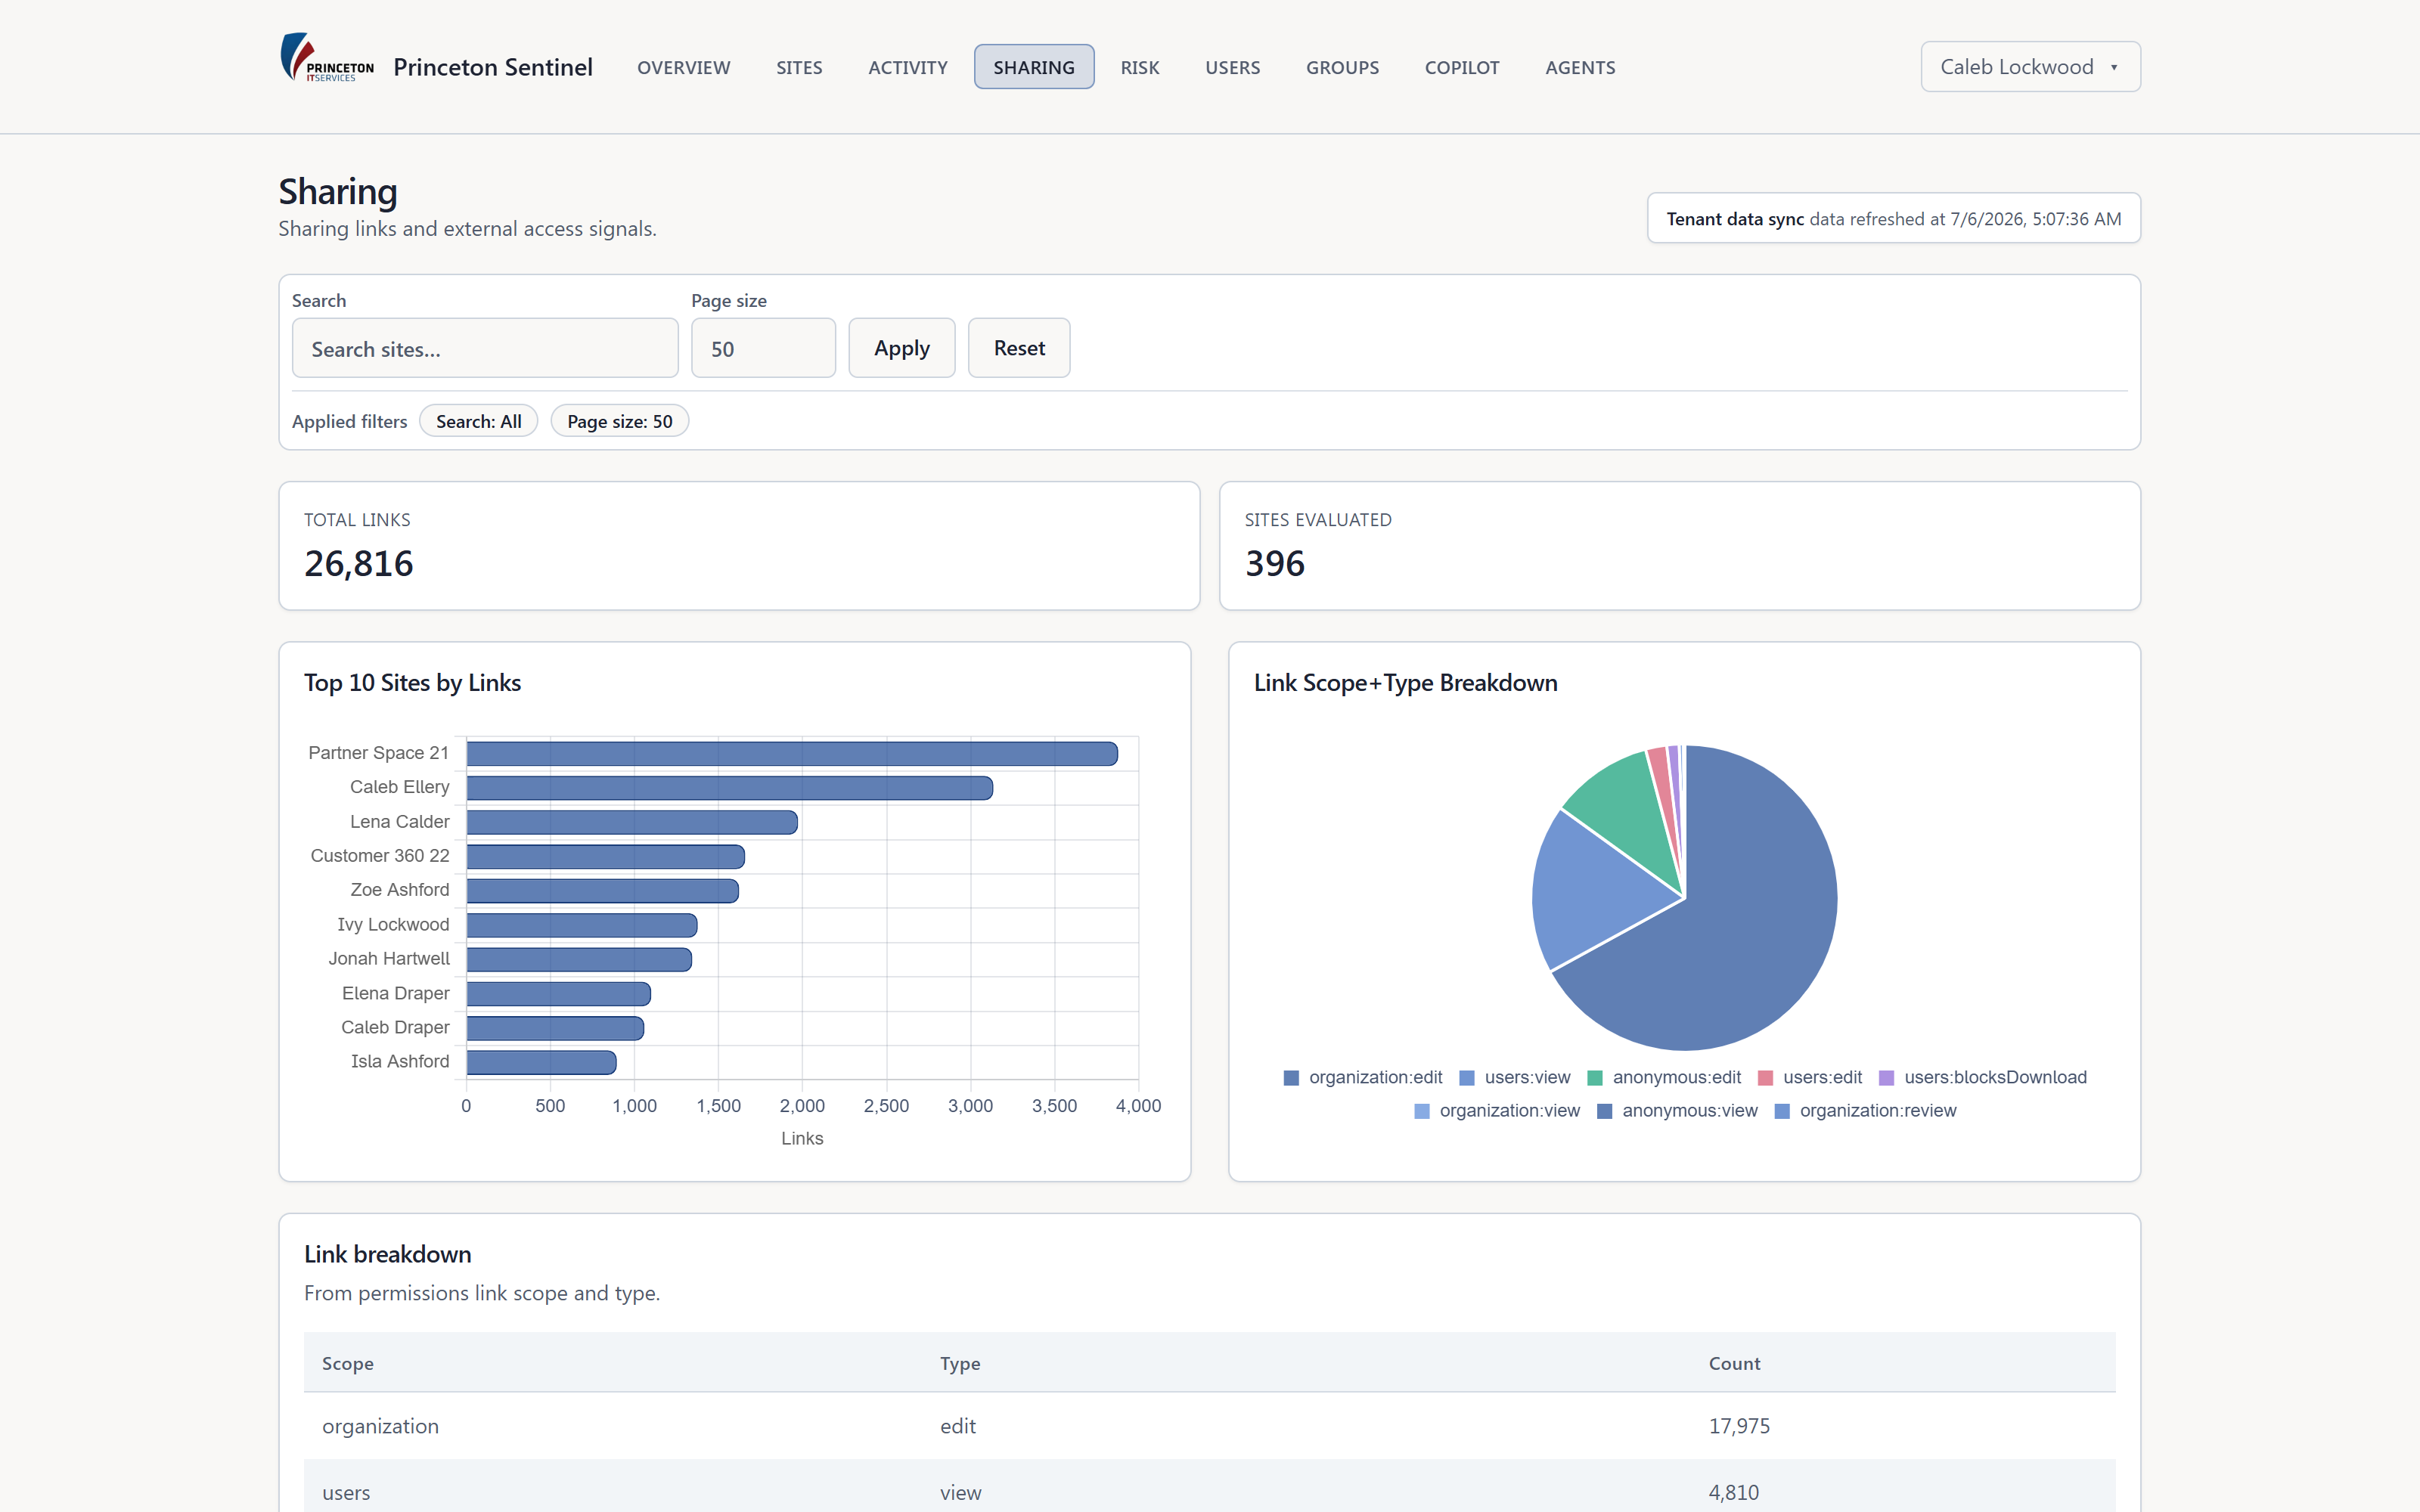
Sharing governance

The exposure map SharePoint never gave you

Link-based sharing is where Microsoft 365 data quietly leaks. Sentinel maps every scope and every external principal across the whole tenant, so 'who can reach this?' finally has an answer.

  • Link scope breakdown - anonymous vs organization vs specific-people links, per site and estate-wide.
  • Guests & external users - surfaced and counted, with the internal domains you define.
  • Per-site sharing posture - sort sites by how widely - and how riskily - they're shared.
  • Straight to remediation - jump from an over-shared site to the revoke workflow in a click.
app.princetonsentinel.com/dashboard/sharing
Sharing posture page with link-scope breakdown and per-site guest and external counts
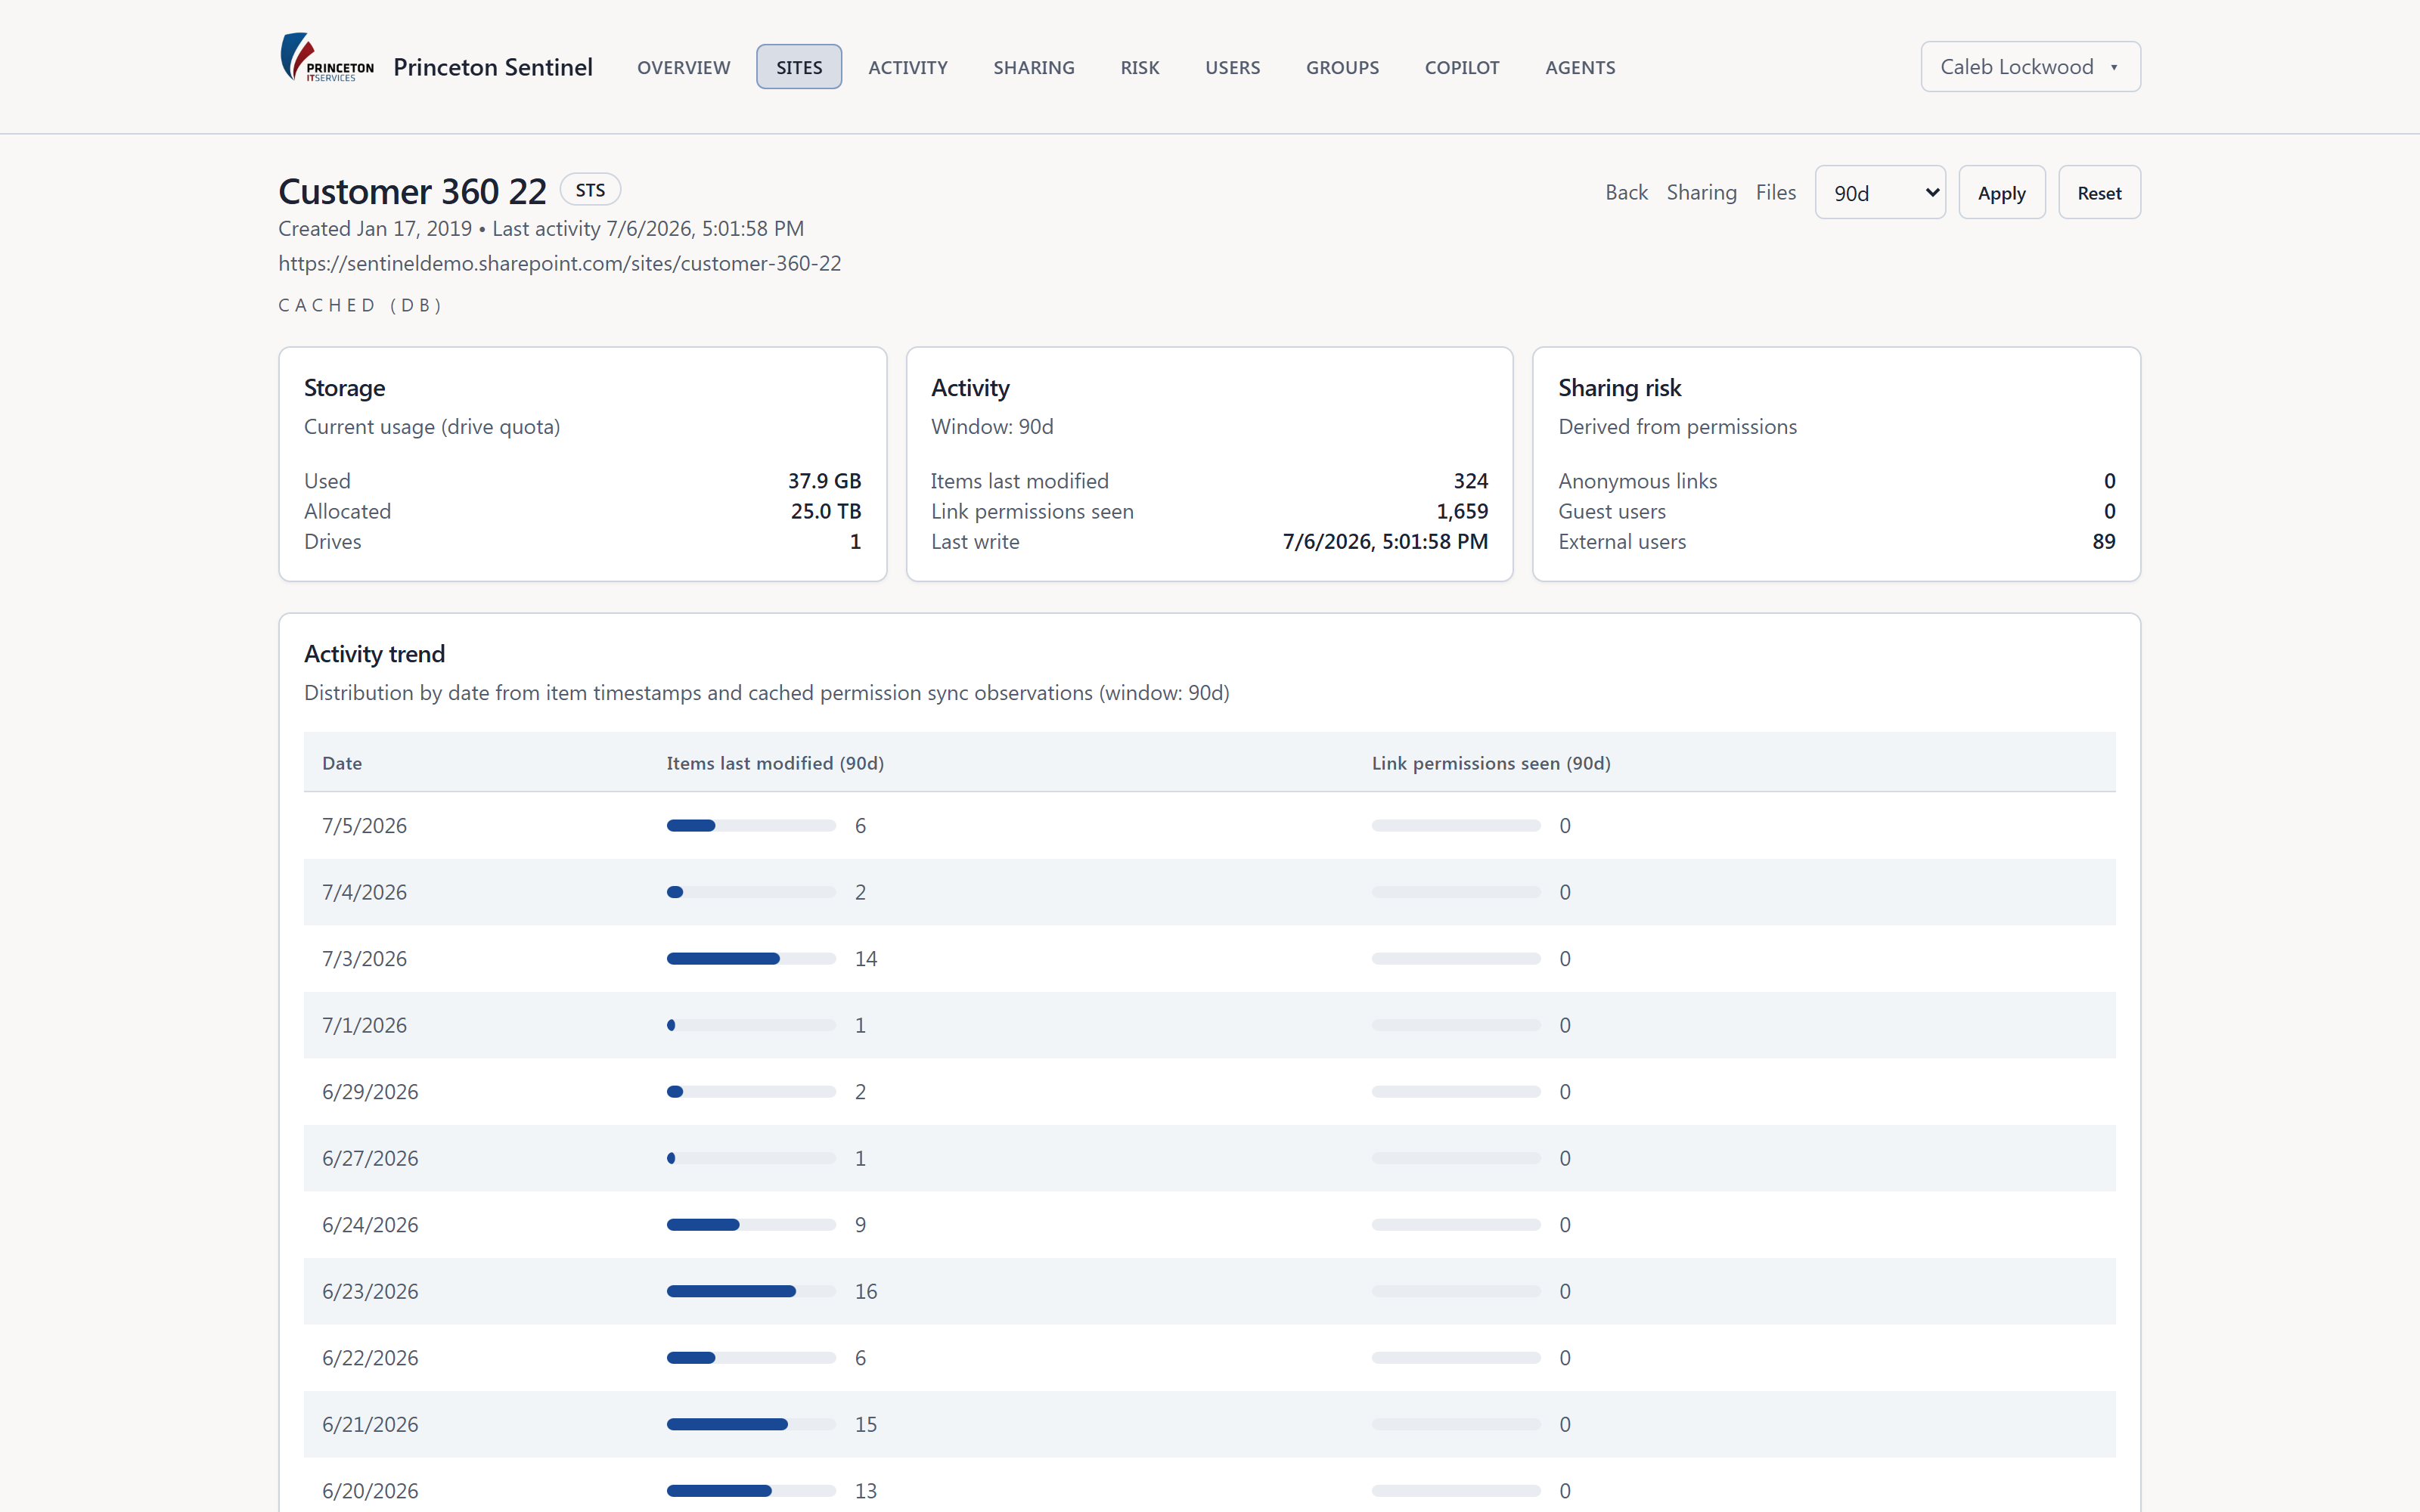
Inventory & drill-down

From tenant-wide to a single file

Every site, drive, user, and group is enumerated and searchable - and every one drills down to the detail your investigation needs.

  • Full inventory - sites, drives, users, and groups, deduplicated and searchable.
  • Site drill-down - storage, activity trend, sharing risk, and top users for any site.
  • Item-level permissions - trace who has access to a specific file or folder, and how.
  • Cached, not live-crawled - fast queries against your own database, not slow Graph calls.
app.princetonsentinel.com/sites
Site drill-down showing storage, activity trend, and sharing-risk breakdown
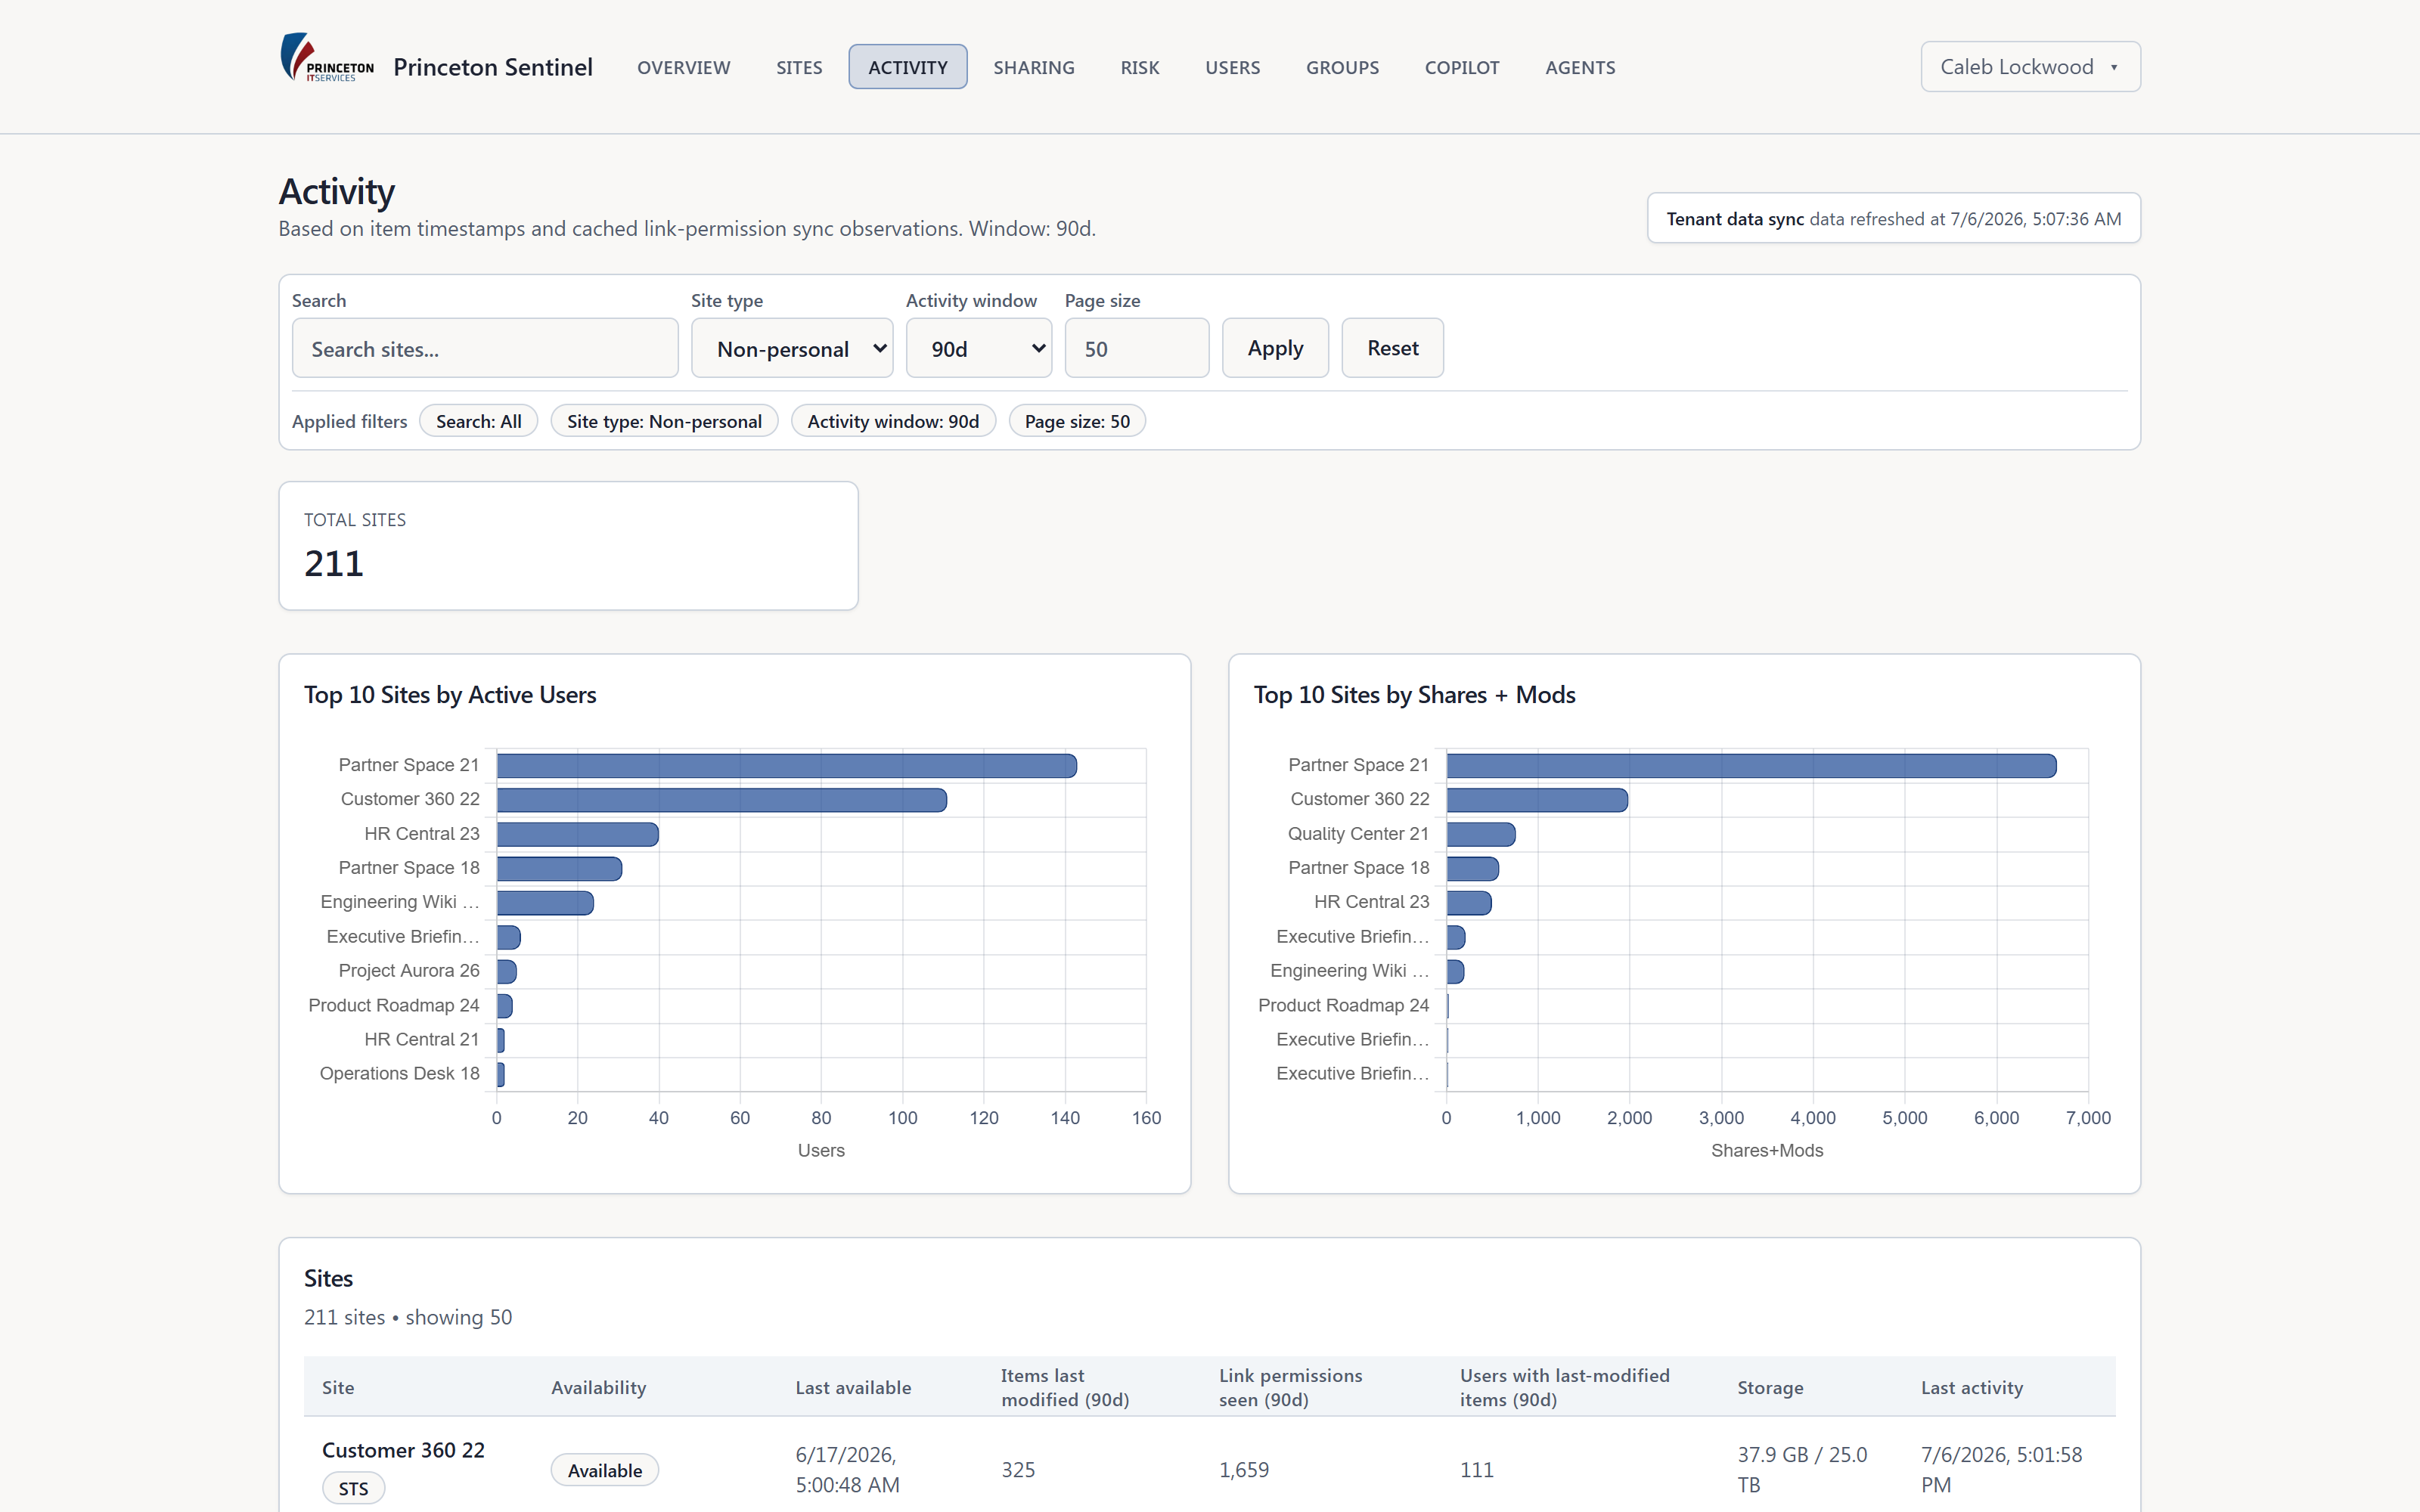
Activity analytics

See where the movement is

Static inventory tells you what exists; activity tells you what's alive. Sentinel trends changes and sharing over time so dormant-but-exposed sites stand out.

  • Activity trends - item changes and sharing activity charted by day across the tenant.
  • Top-moving sites - the sites generating the most change, ranked.
  • Dormancy signals - surface sites that are stale yet still broadly shared.
app.princetonsentinel.com/dashboard/activity
Activity analytics with daily change trend and top active sites
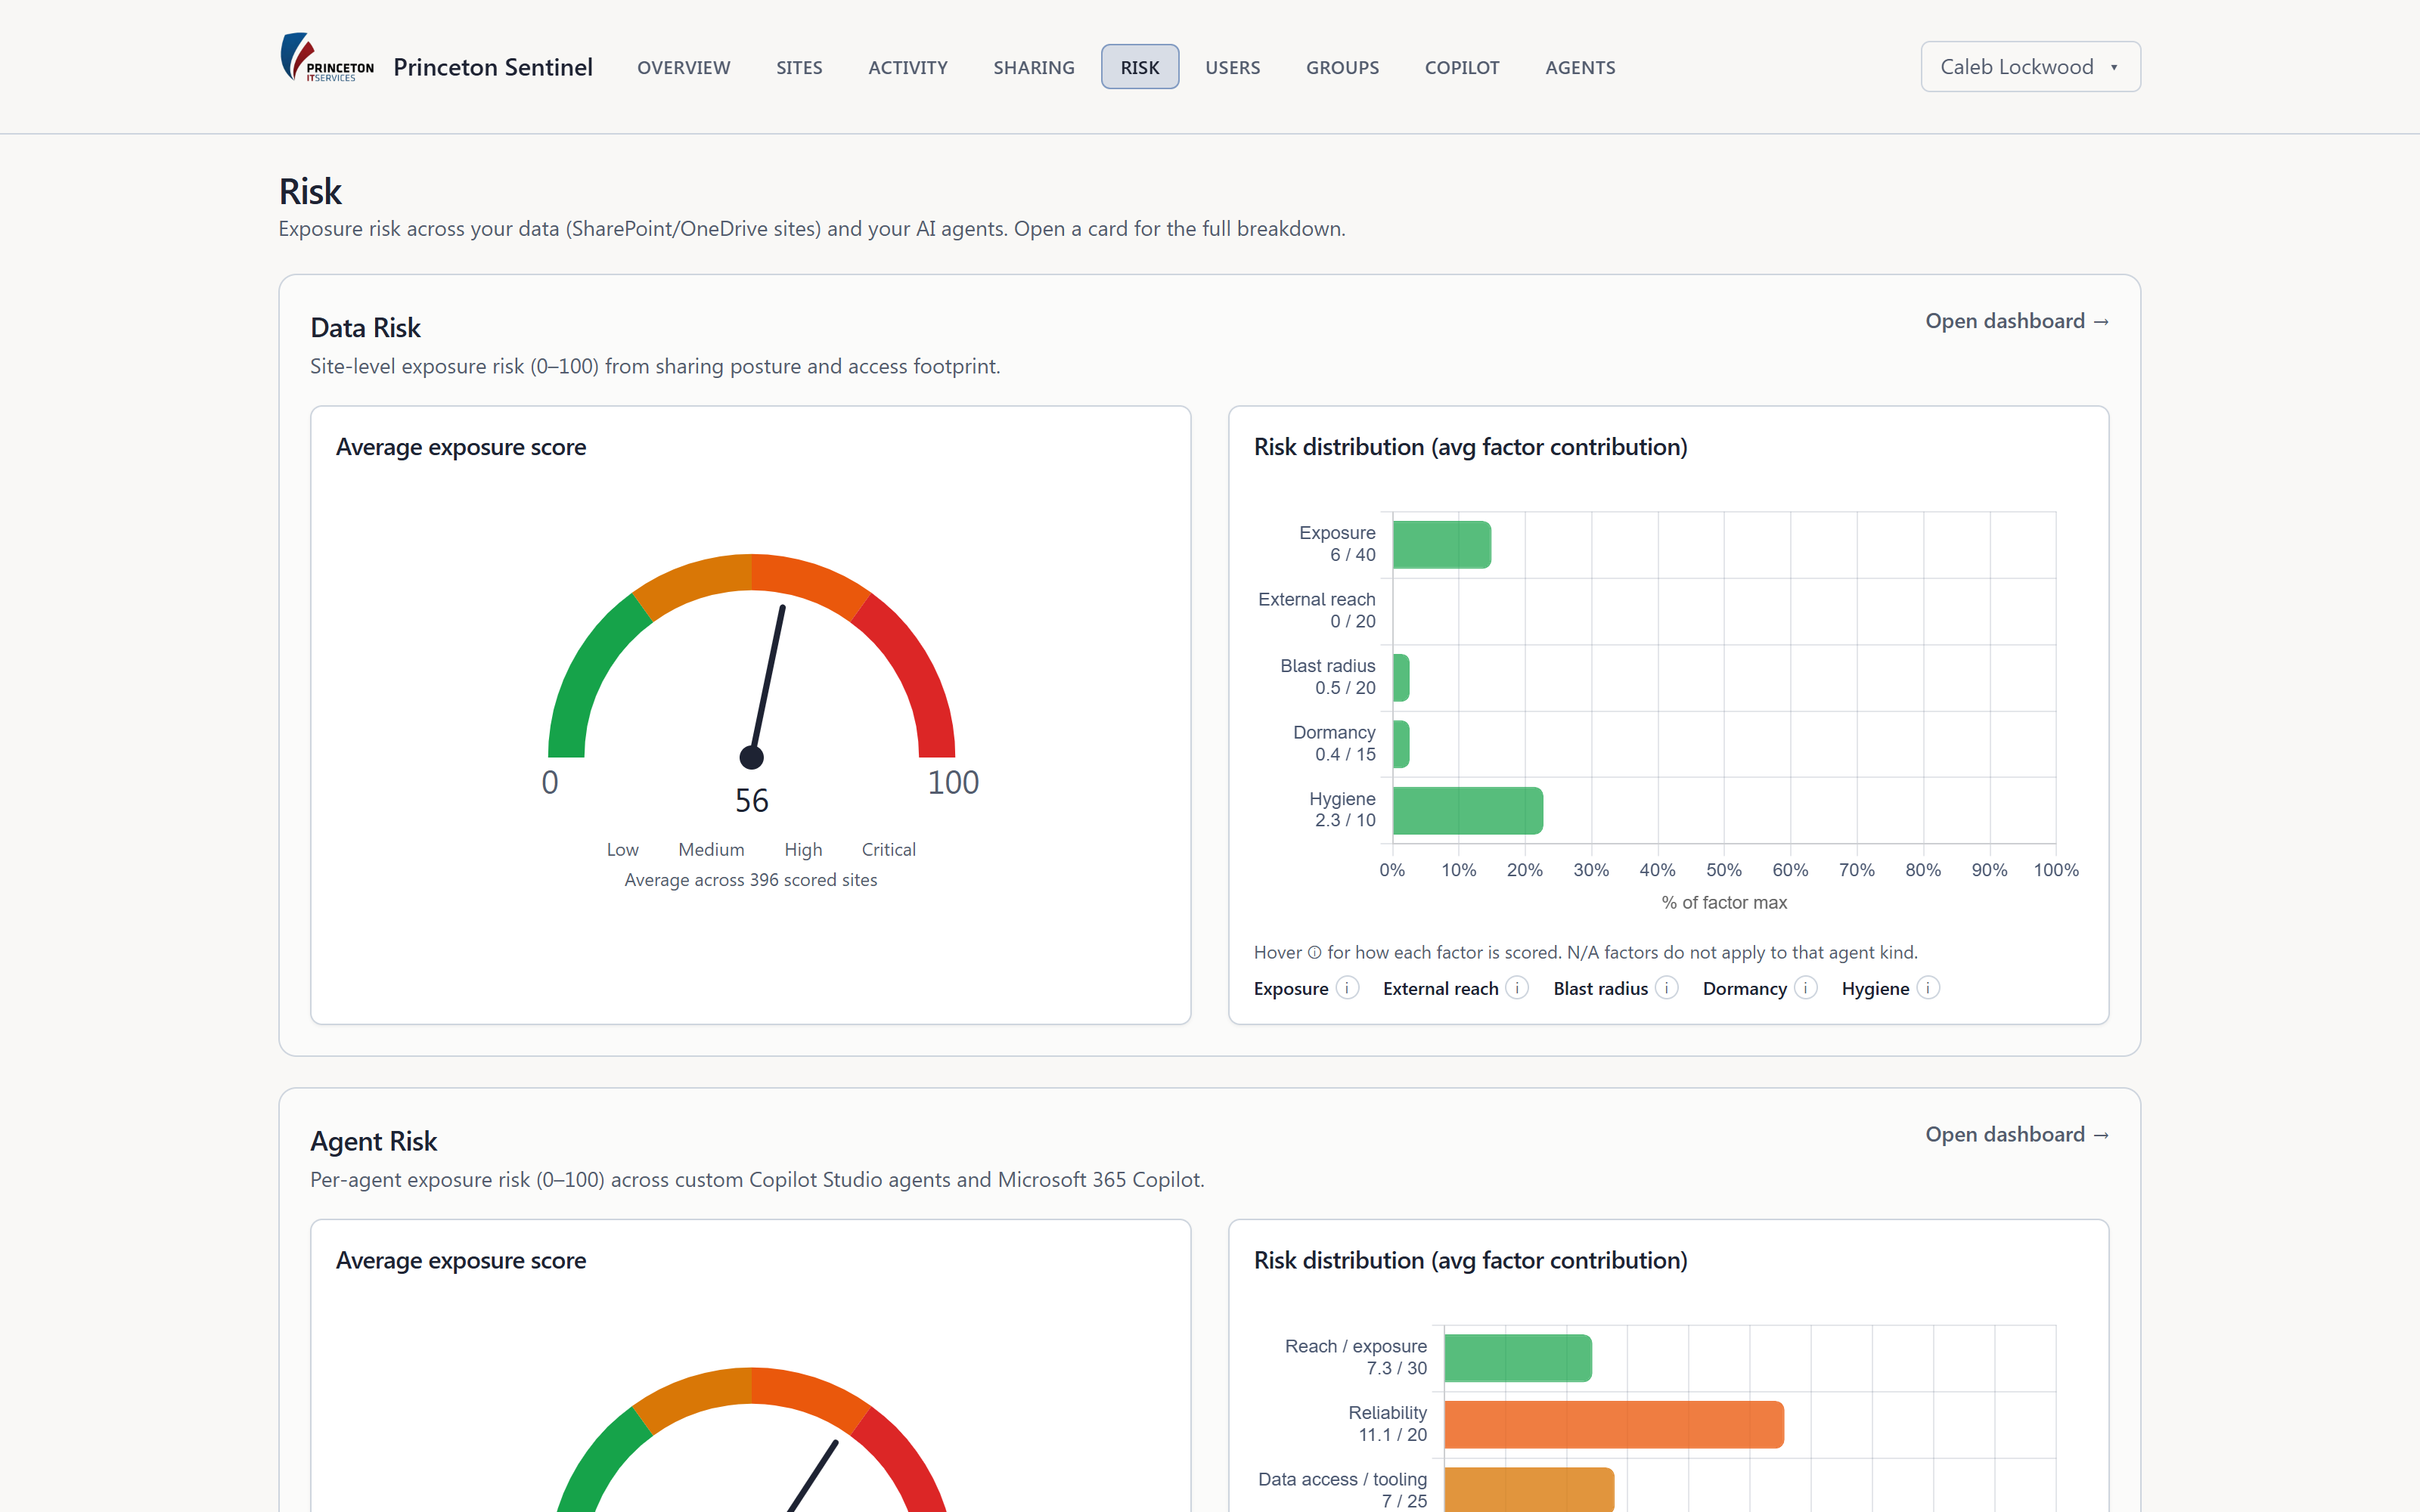
Risk hub

Data risk and agent risk, side by side

The risk hub rolls both scoring engines into one view - so leadership sees the whole exposure picture, and analysts jump straight to the worst offenders.

  • Unified risk view - data-risk and agent-risk gauges and summaries in one place.
  • Drill by level or factor - filter to critical, high, or a specific exposure factor.
  • Prioritized queue - the highest-exposure sites and agents float to the top.
app.princetonsentinel.com/dashboard/risk
Risk hub combining data-risk and agent-risk gauges and summaries
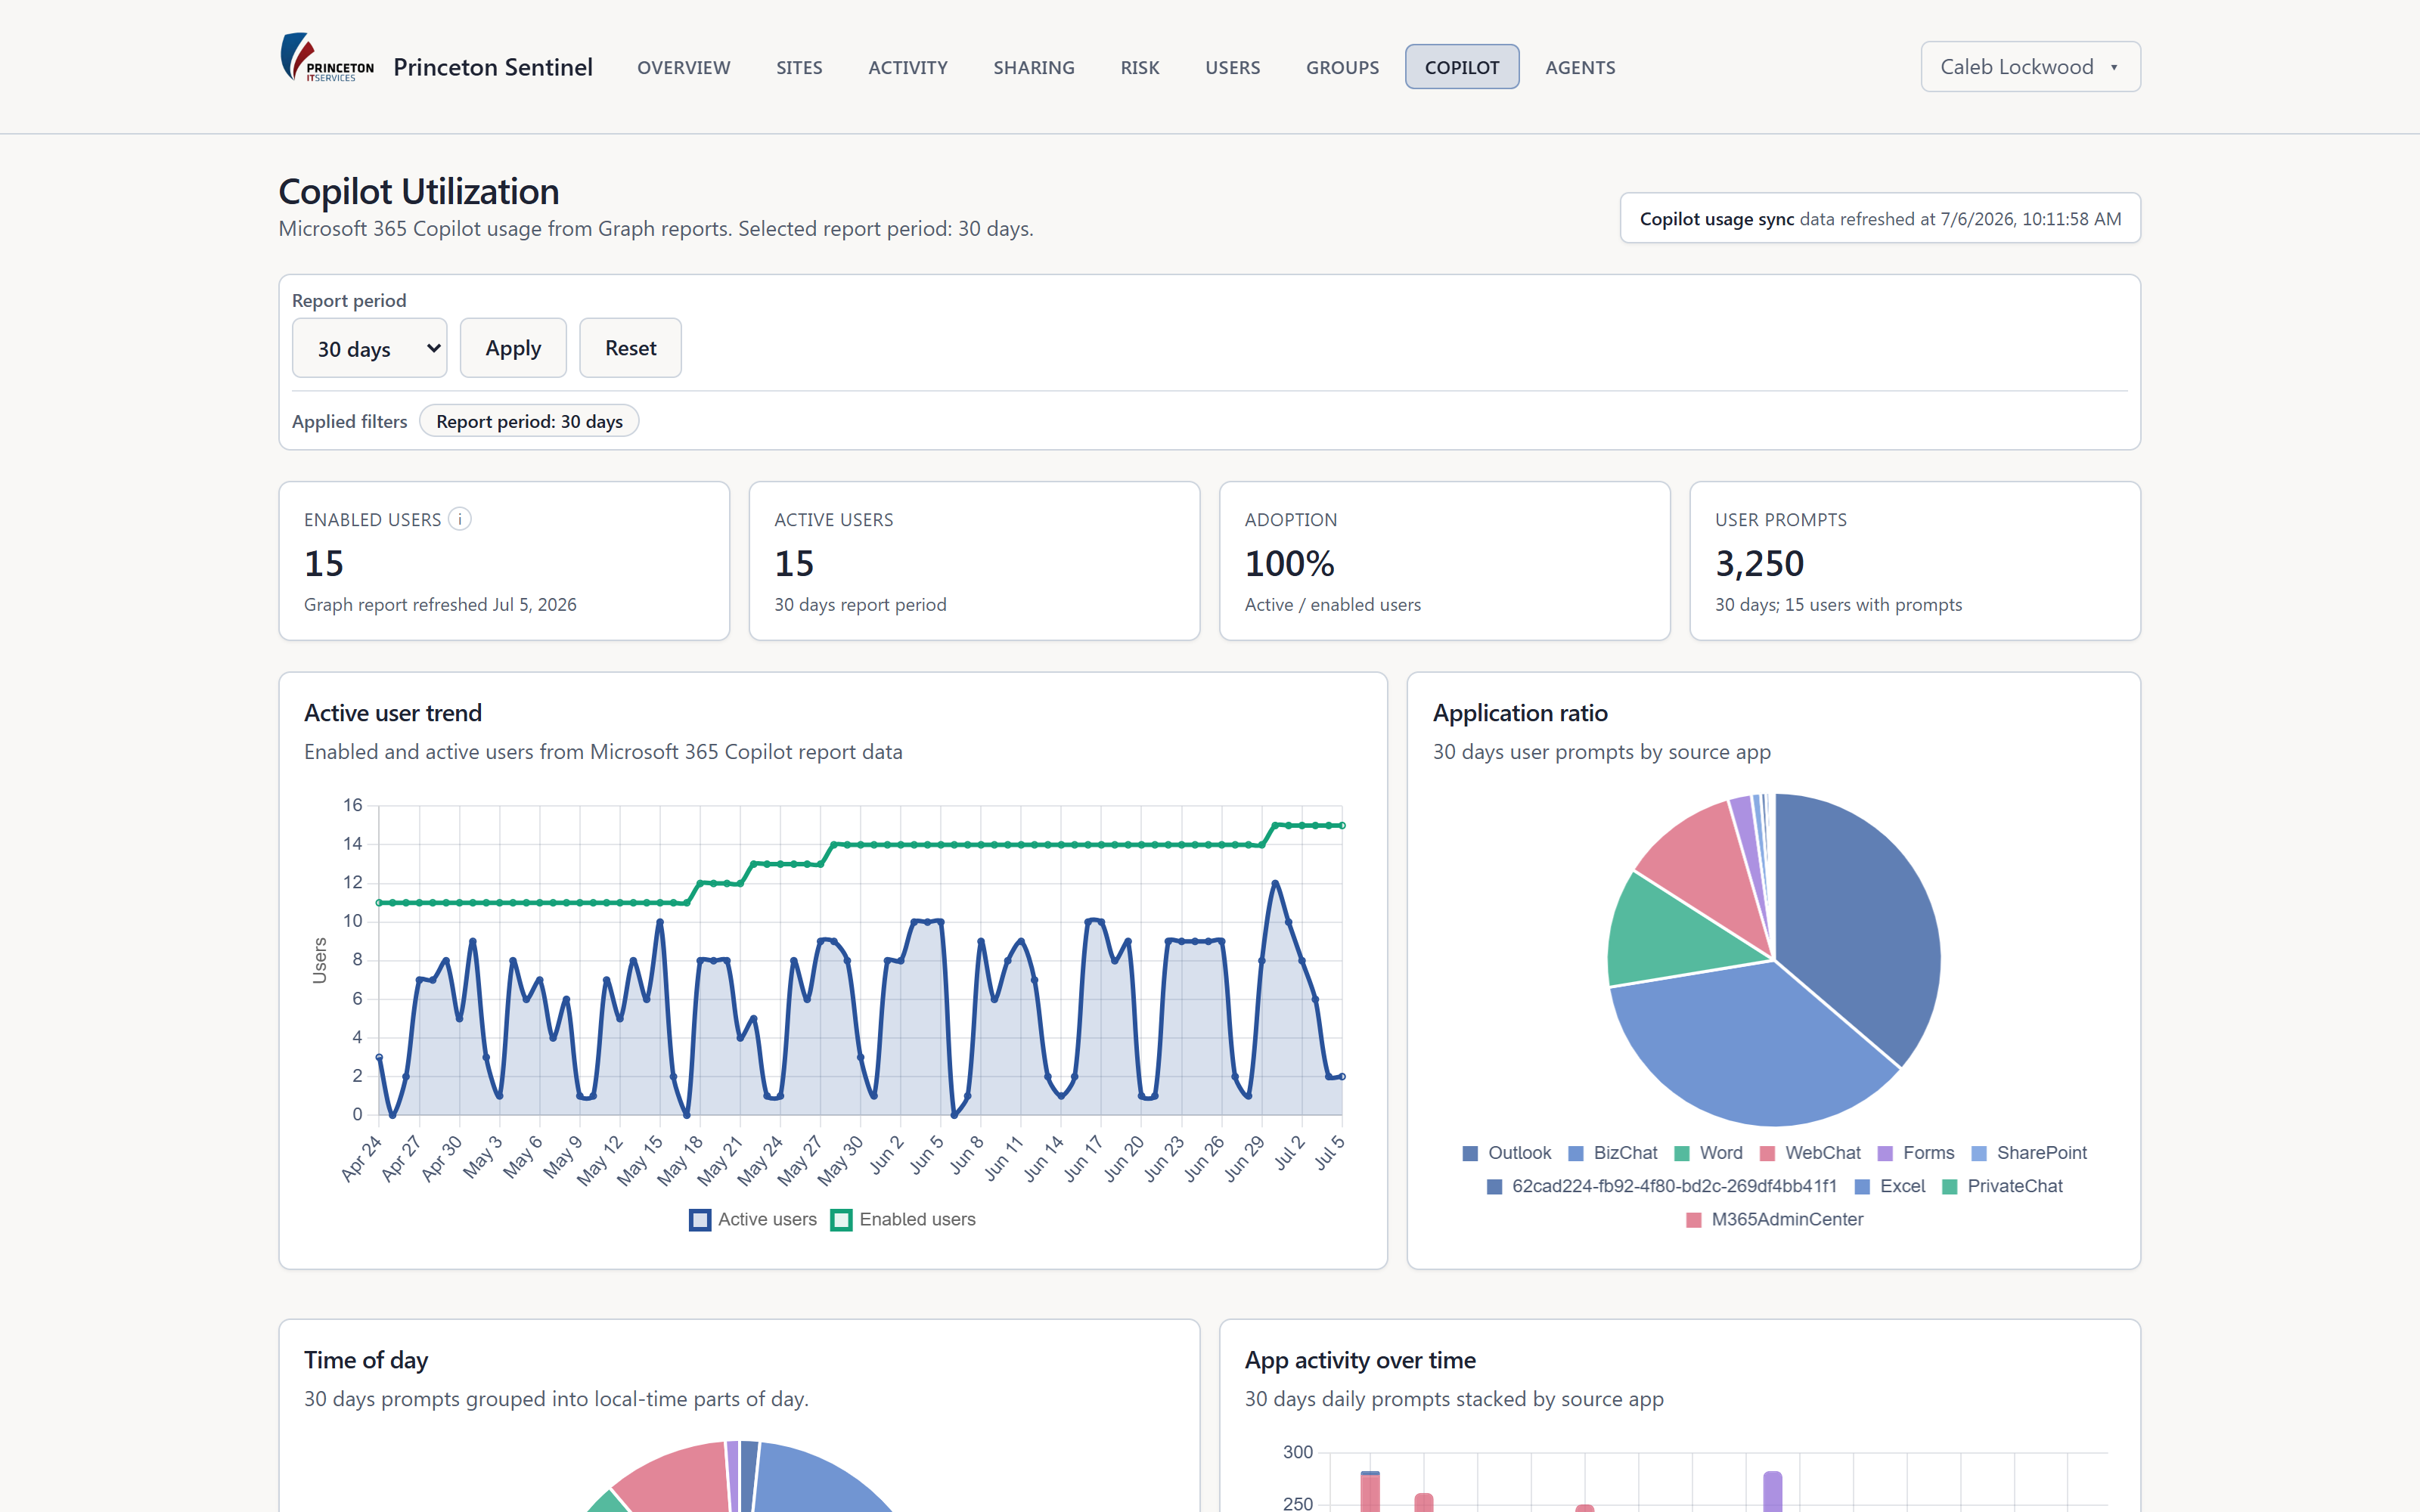
Copilot adoption

Measure Copilot, don't guess

Rolling out Microsoft 365 Copilot? Sentinel tracks adoption by app and department so you can show impact - and spot licenses going unused.

  • Adoption trend - enabled vs active users over time, at a glance.
  • By app and department - see where Copilot is landing across the org.
  • Per-user detail - drill into individual usage when you need it.
app.princetonsentinel.com/dashboard/copilot
Copilot adoption analytics with usage trend and per-app breakdown
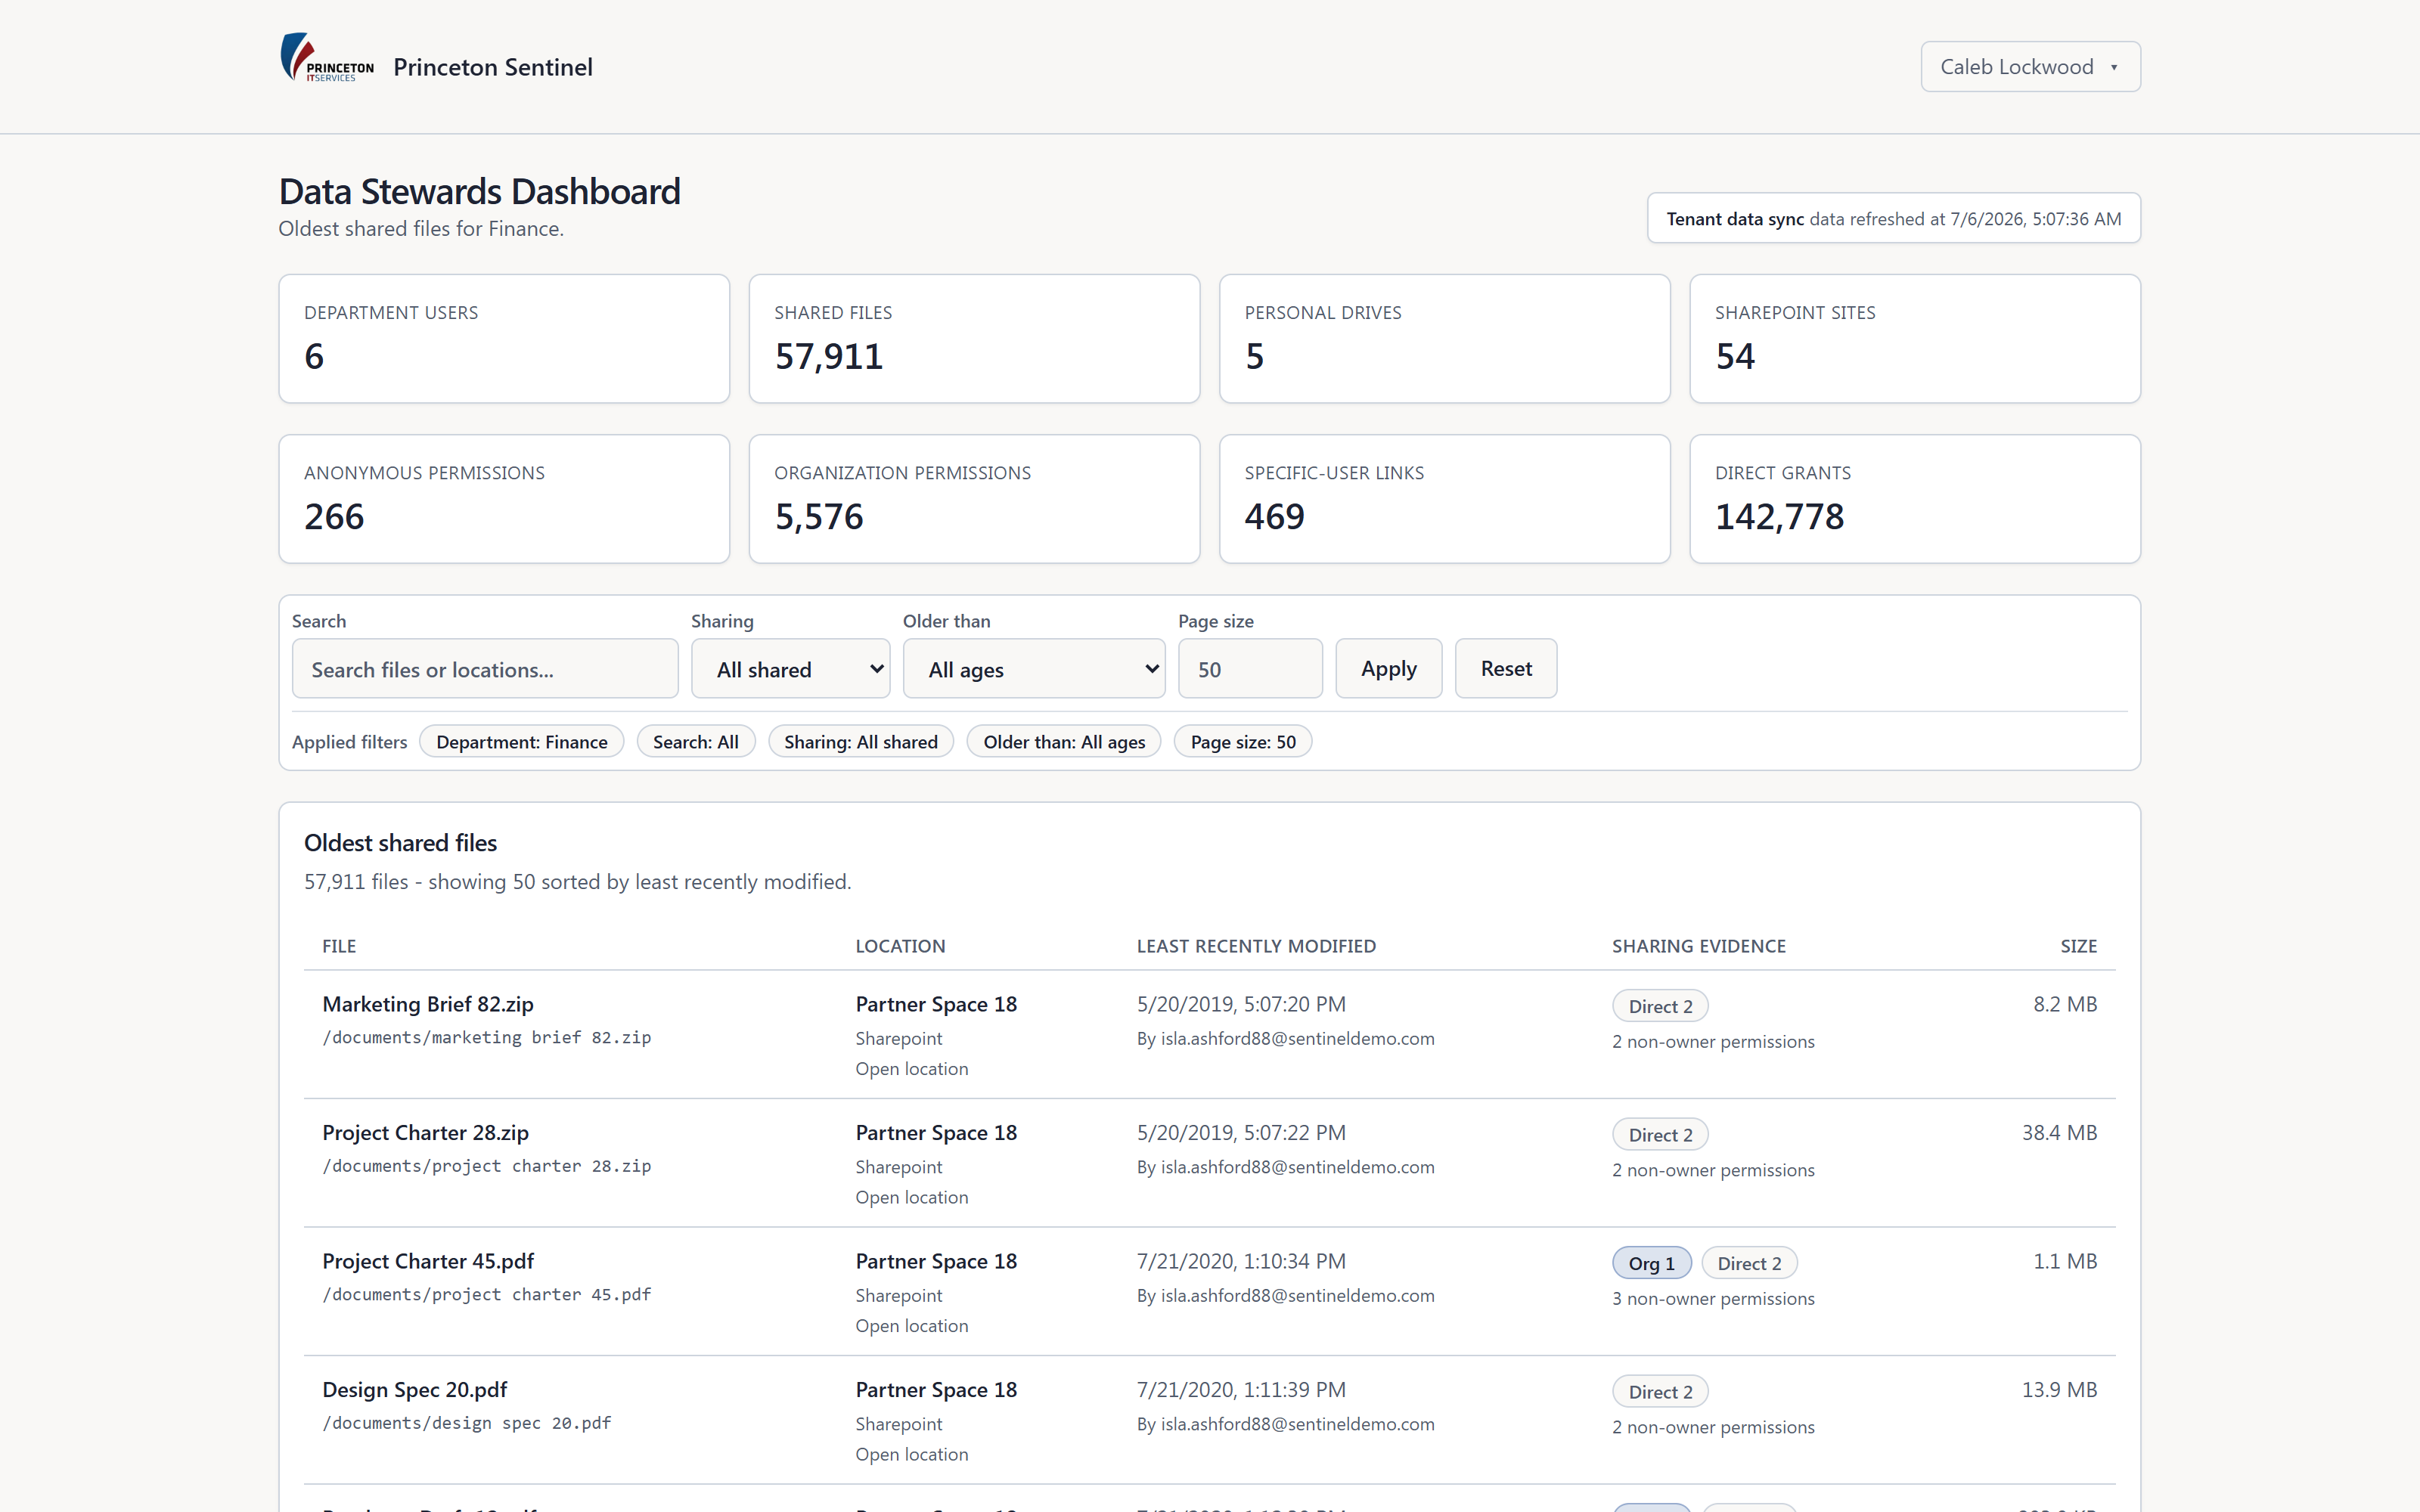
Delegated data stewardship

Push remediation to the people who own the data

A central security team can't personally review every site. Sentinel gives each department its own scoped dashboard, so data stewards clean up their own team's exposure - no full-admin access required.

  • Department-scoped - each steward sees only their own department's shared files, resolved from Entra ID.
  • Oldest-first triage - the least-recently-touched, most-exposed files surface at the top of the list.
  • Sharing evidence - anonymous, organization, specific-user, and direct grants shown per file.
  • Least privilege - gated by its own Entra ID group - stewards never touch the full admin console.
app.princetonsentinel.com/data-stewards
Data Stewards Dashboard scoped to the Finance department, listing the oldest shared files with sharing evidence
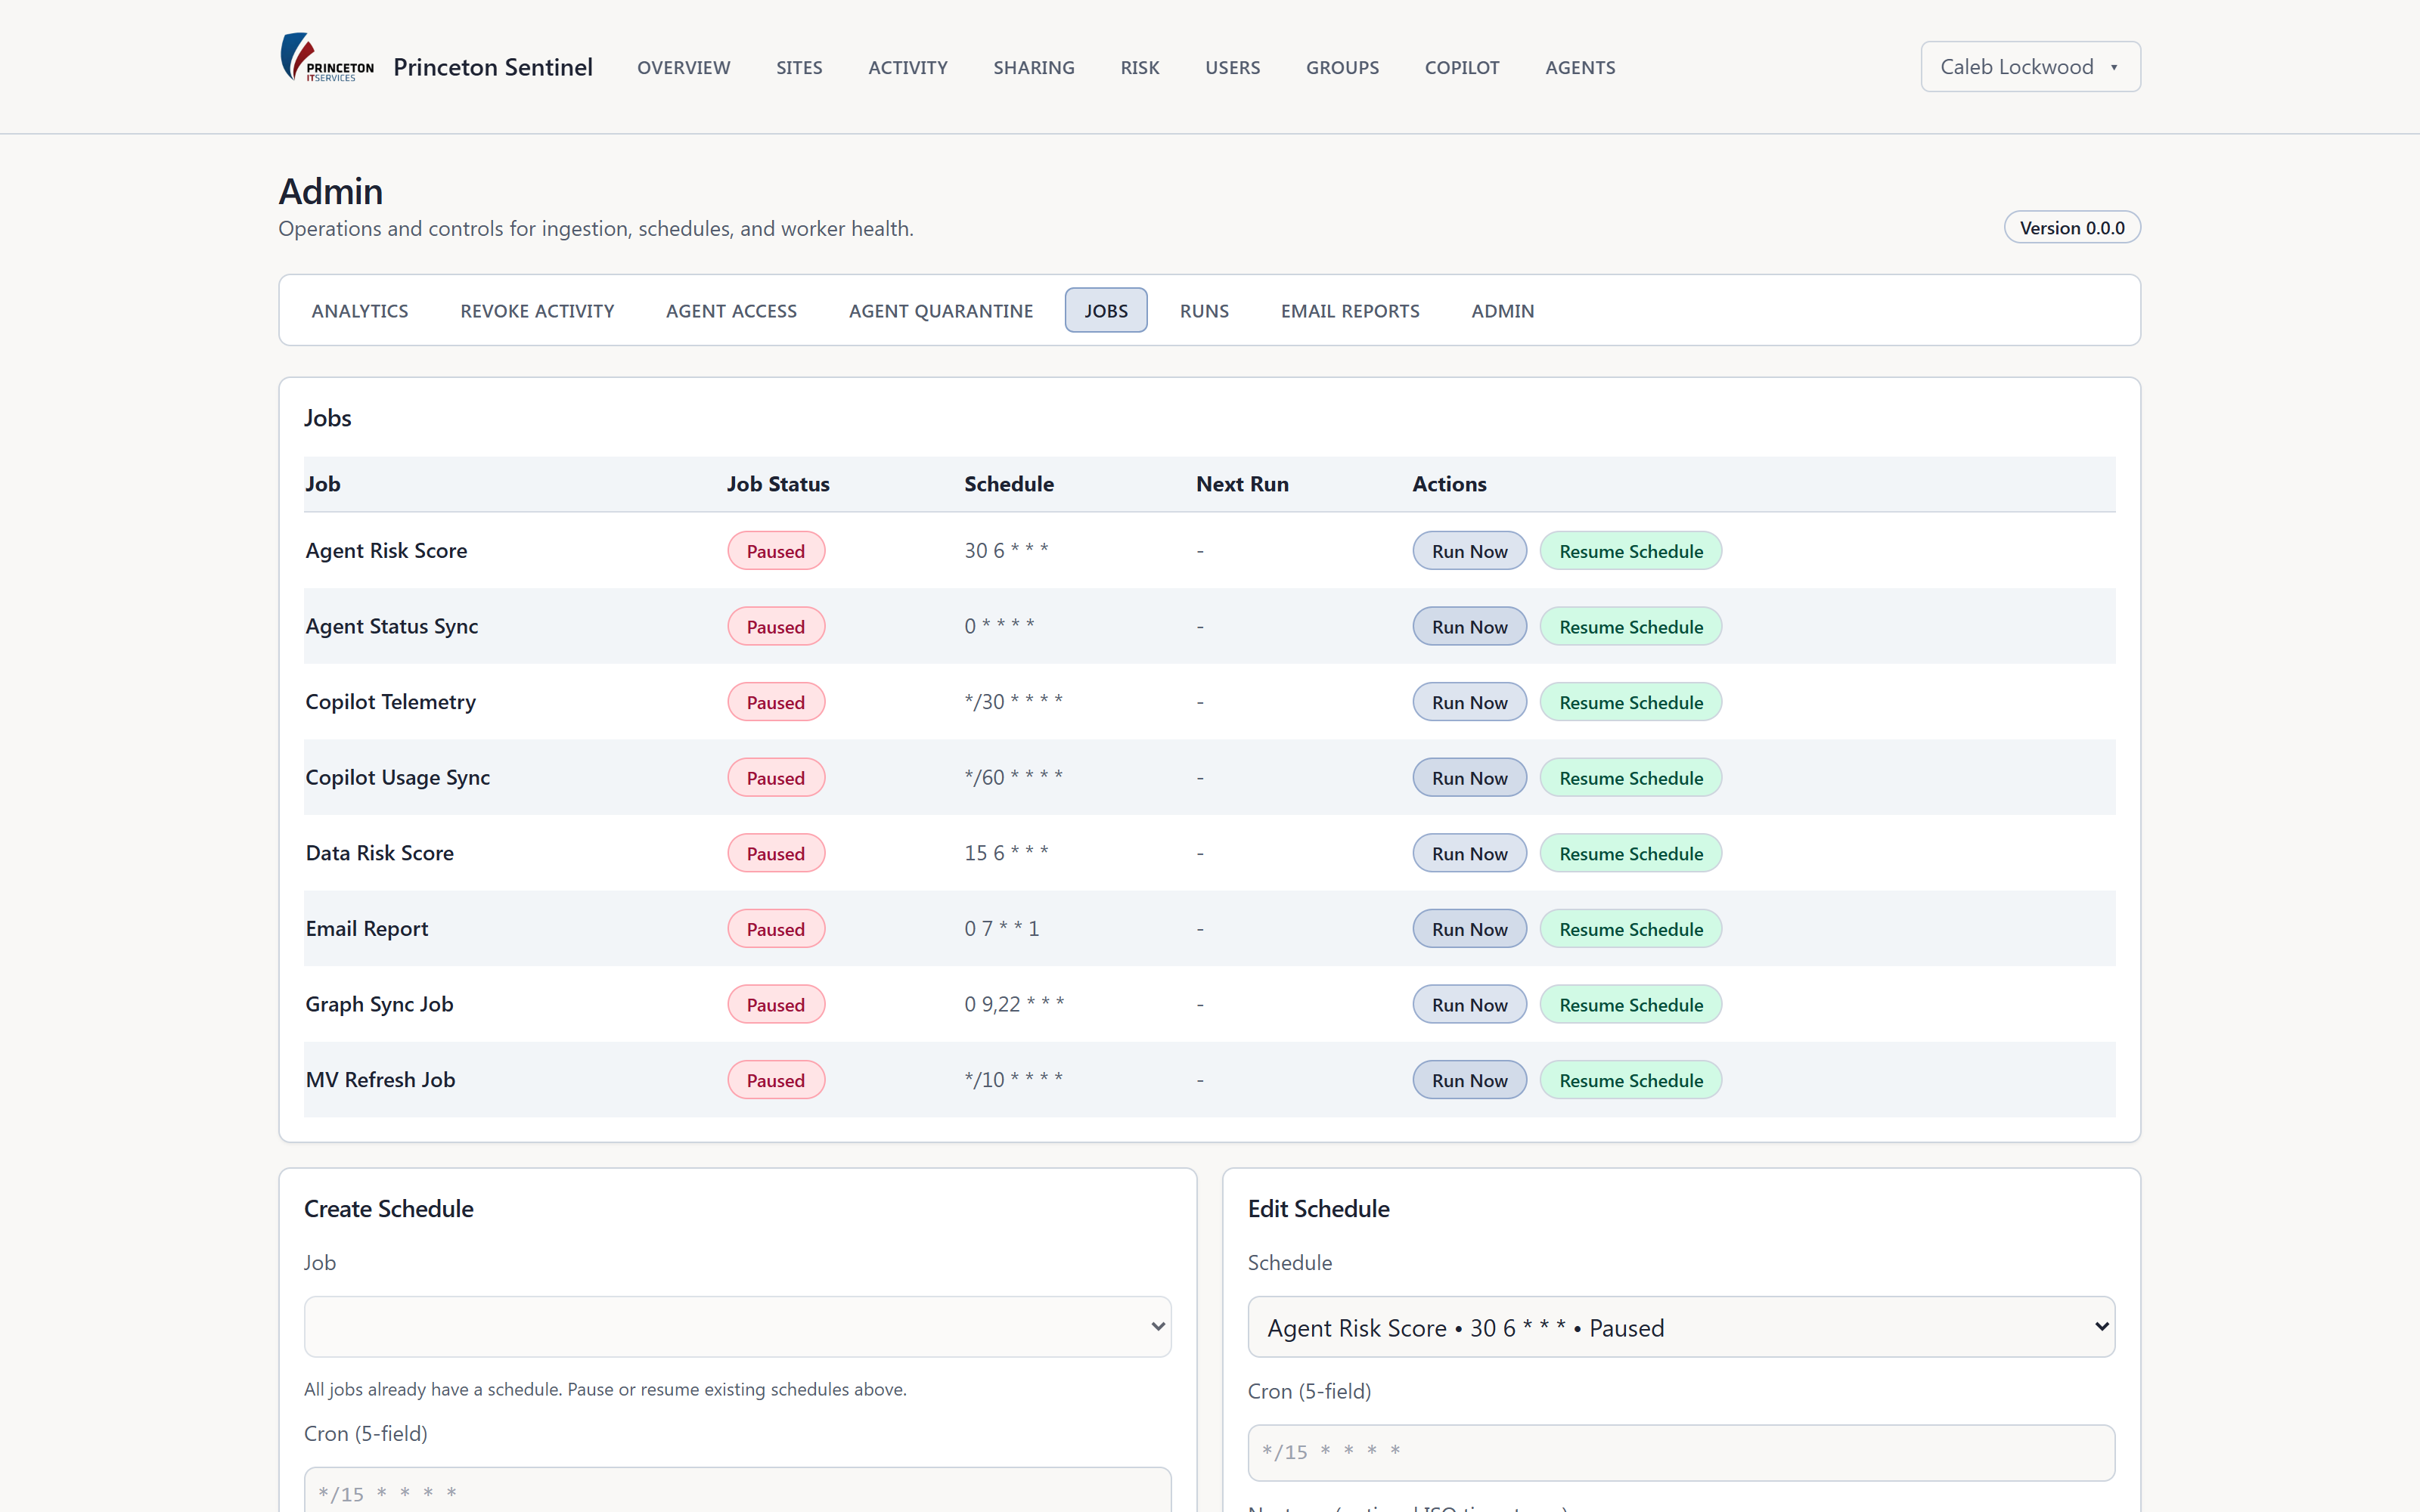
Operations

Admins stay in control

A dedicated admin area - gated by its own Entra ID group - runs the ingestion jobs, schedules, and email reports, with full run history and export.

  • Job scheduling - control the Graph ingest, scoring, and refresh jobs and their cadence.
  • Run history & logs - every job run, its status, and its logs, kept for audit.
  • Scheduled email reports - posture summaries delivered to the stakeholders you choose.
  • Worker health - know the pipeline is running - or exactly why it isn't.
app.princetonsentinel.com/admin
Admin operations panel with the job scheduler, cron schedules, and run controls

See Sentinel on your own tenant

A 30-minute walkthrough on your data: exposure scores, agent risk, and a rollout plan for your Azure environment.

Request a demo